This will be a deeper dive into the different phases of the data analytics lifecycle and serves as a continuation for the Data Analytics Lifecycle Overview.
Data Analytics Lifecycle Overview
Stages of the Data Analytics Lifecycle
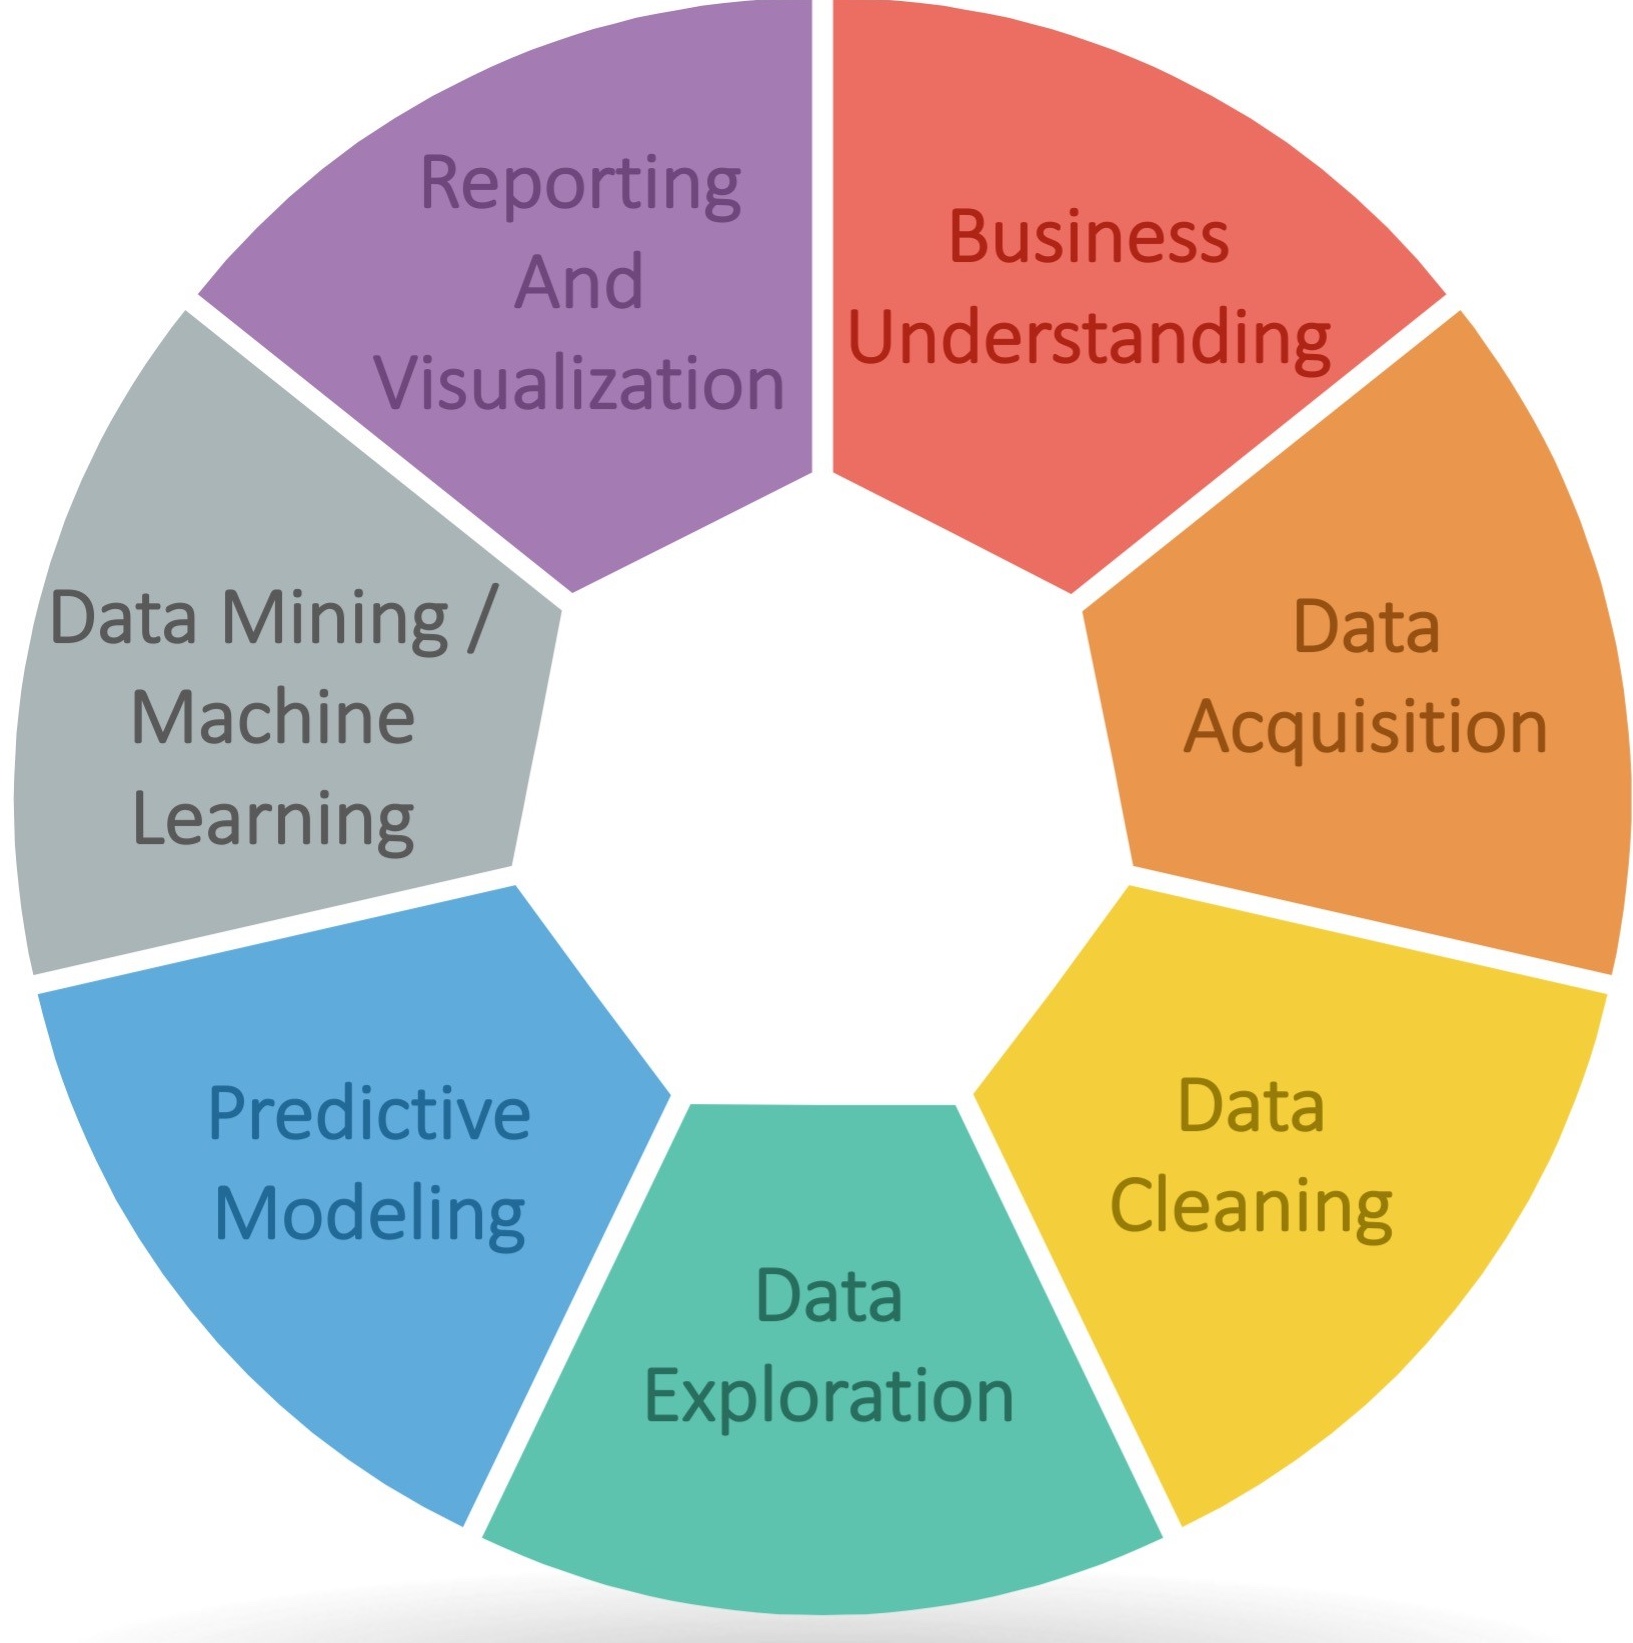
- Business Understanding (Discovery)
- Data Acquisition (Collection)
- Data Cleaning (Preparation)
- Data Exploration (Exploratory Data Analysis)
- Predictive Modeling (Data Modeling)
- Data Mining (Machine Learning)
- Data Reporting & Visualization (Representation & Communication)
Business Understanding
This phases involves gaining a business understanding of the problem or mission objective. Analysts will define major questions of interest, the needs of stakeholders, resources, and constraints.
Data Acquisition
This is the phases where the data is collected from various sources. Data can come from either internal data sources such as databases or via external sources such as APIs or web scraping. Analyst will typically use SQL to query and store data in a structured format.
Data Cleaning
Once the data has been acquired, data will need to be cleaned and prepared to ensure a high level od data quality. This involves fixing improperly formatted values, dealing with duplicates, missing data, and outliers. Data cleaning is essential to ensure the accuracy of the analysis and skipping this step can result in faulty perceptions of the data. This step can be done with tools such as Python, R, or SQL.
Data Exploration
Analysts will explore the data to gain a better understanding of the data and its relationships. Exploratory data analysis (EDA) is used to discover patterns, identify basic correlations between variables, and summarize the main characteristics of the data. Sometimes, data visualization tools such as Tableau are used to create insightful graphs that showcase trends and forecasts.
Predictive Modeling
Analysts will then build predictive models to estimate or project future outcomes. Python and R are used to help automate and the training and use of these models.
Data Mining
Data mining is the process of using machine learning algorithms to identify patterns in the data. This can include supervised and unsupervised models, clustering, and classification. Analysts will create training and testing datasets to build models from and determine if groups exist in the data.
Data Reporting & Visualization
Analysts will tell a story with the data using graphs or interactive dashboards to present the data to other analysts or key stakeholders providing insights and summaries of the analysis. These insights and summaries can provide actionable insights and drive business decisions.
Quick Reference Table
| Phase of Life Cycle | Other Names | Topics of Interest | Potential Problems |
|---|---|---|---|
| Business Understanding | -Planing -Discovery | -Scope project-Identify stakeholders and research questions/key performance indicators (KPIs)-Identify timeline, budget, and participants | -Lack of clear focus on stakeholders, timeline, limitations, or budget could potentially derail an analysis. |
| Data Acquisition | -Extraction-Data Gathering-Data Query-Data Collection-ETL(Extract, Transform, Load)-WebScraping | -Gather/collect data from a variety of sources-Provide structure to data accessible via relational databases (SQL)-Build data pipeline (ETL)-Use of API to download data from an external source | -Quality and type of data may make access more difficult. |
| Data Cleaning | -Wrangling-Scrubbing-Munging | -Fixing improperly formatted values-Deal with duplicates, missing data, and outliers-Reduce data | -Some cleaning techniques could dramatically change data/outcomes.-Outliers not dealt with can cause problems with statistical models due to excessive variability. |
| Data Exploration | -Exploratory data analysis (EDA)-Descriptive statistics | -Central tendency/measures of center (e.g., mean, median, mode), variability (e.g., standard deviations and quartiles), and distributions (e.g., normal, skewed)-Identify basic correlations between variables-Discover pattern | -Skipping this step could enable faulty perceptions of the data, which hurt advanced analytics. |
| Predictive Modeling | -Data modeling-Correlation-based models-Regression models-Time series | -Estimate/ project future values or likelihood of an event-Extend correlations found in EDA to mathematical models-Predict/ determine output values based on input values-Cross-validate predictive models to ensure accuracy | -Too many input variables (predictors) can cause problems.-Correlation does not imply causation.-Time series models often need sufficient time data to offer precise trending.-Predictive model accuracy should be assessed using cross-validation. |
| Data Mining | -Machine Learning-Deep Learning-Ai(Artificial Intelligence)-Supervised/ unsupervised models | -Create training and testing datasets to build models from-Identify/ detect patterns-Determine if groups (clusters) exist in the data-Classify data into groups-Create models that “learn” and improve (e.g., machine/deep learning, AI) | -Running on entire data is problematic; need to subset data into training and testing datasets to build models. |
| Reporting & Visualization | -Dashboards | -Tell a story with data-Provide a summary of analytics analysis-Provide insights to stakeholders-Create insightful graphs that showcase trends and forecasts | -Due to potential large audience consumption, mistakes can cause bad business decisions and loss of revenue.-Improper scales used in graphs could push for inaccurate interpretations of the story. |
Source: Table sourced from WGU Data Analytics Program